Barrick Mining Stock Analysis 2026: 5 Critical Risks
Barrick Mining Stock Analysis 2026: 5 Critical Risks Investors Must Weigh
Key takeaways
- Barrick Mining stock fails three of five Moschovakis Capital wealth preservation requirements at $38.72, producing an automatic AVOID verdict.
- WP Score: 48/100 — below the 65 threshold required for a Wealth Preservation candidate.
- Probability-weighted base case implies 5.2% CAGR, with bear case at -6% CAGR and bull case at 14% CAGR over 10 years.
- The dominant risk is jurisdictional: 40-50% of production sits in Mali, Pakistan, Tanzania, Zambia, and Papua New Guinea.
- Verdict: AVOID at current price. Re-review trigger sits below $30.
Executive Summary: Barrick Mining Stock Verdict
Barrick Mining Corporation (B) trades at $38.72 with a Wealth Preservation Score of 48/100, failing the bear case return floor, the 7% base case hurdle, and the 10% maximum permanent loss probability. The fortress balance sheet and Tier One asset base are real, but commodity exposure and host-government renegotiation risk in Mali, Pakistan, and Tanzania disqualify the equity for capital preservation. Verdict: AVOID at current Barrick Mining stock price; reassess below $30.
Table of Contents
- The Barrick Mining Stock Thesis in 90 Seconds
- Business Quality: Tier One Assets, Cyclical Economics
- Balance Sheet Fortress
- Barrick Mining Dividend: Variable by Design
- Valuation: Cheap on Spot, Expensive on Normalized
- Scenario Analysis
- Jurisdictional Risk: The Disqualifier
- Peer Comparison vs Newmont and Agnico Eagle
- Monitoring Triggers
- FAQ
The Barrick Mining Stock Thesis in 90 Seconds
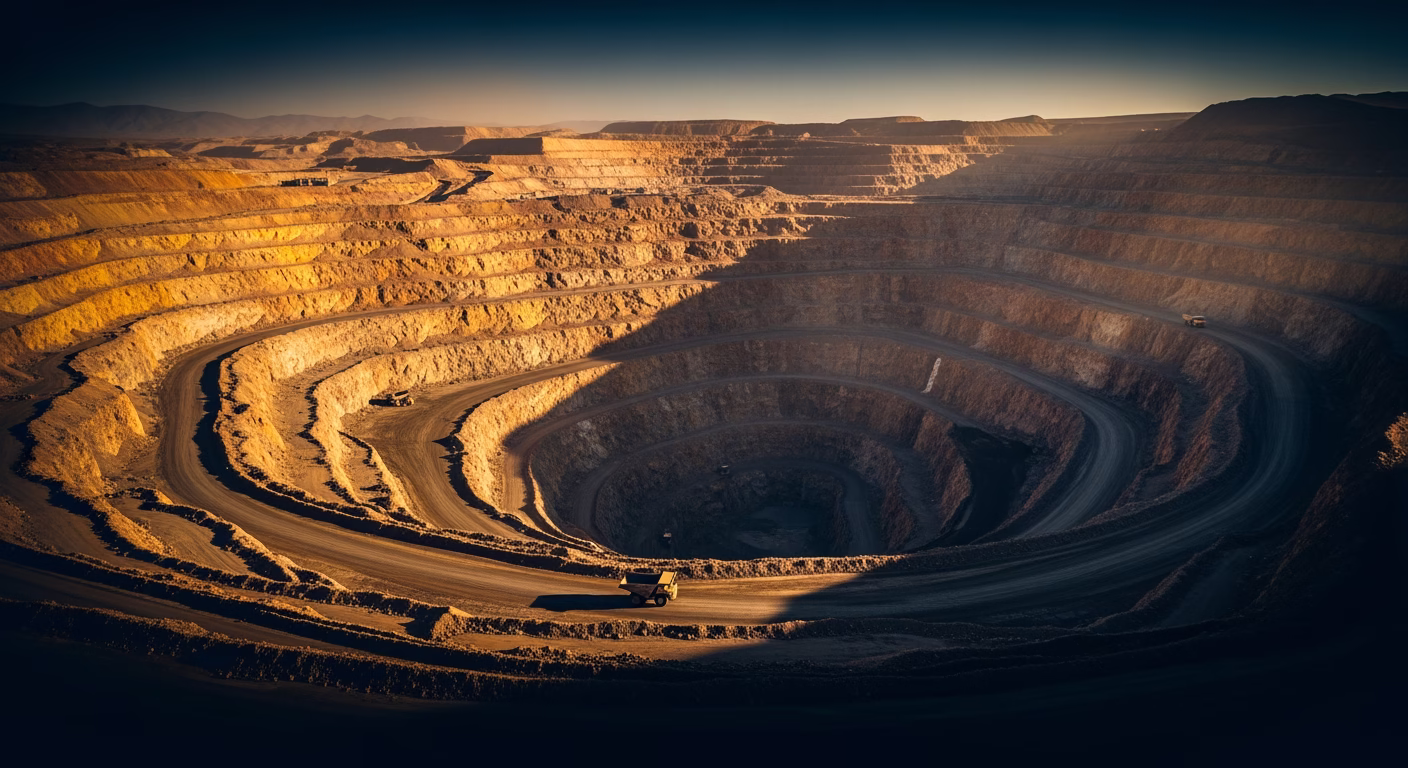
You are looking at a $50B gold and copper miner with six Tier One mines, a credible owner-operator under CEO Mark Bristow, and net debt of roughly $0.5B against $7B+ EBITDA. That is a strong operating business by conventional measures, as confirmed in the company’s latest investor disclosures.
The problem is structural. Barrick Mining stock is a leveraged bet on the gold price, wrapped around mines in Mali, Pakistan, Zambia, Tanzania, and Papua New Guinea. Host governments have already shown they will renegotiate contracts when commodity prices spike. That asymmetry does not belong in a wealth preservation portfolio.
At $38.72, you are paying roughly 13x trailing earnings on a record gold-price year and 10-11x forward earnings that already assume gold stays elevated. Free cash flow yield sits near 3-4%. Barrick Mining dividend yield is 1.7%. Strip out cyclical tailwinds and normalized earnings power supports a Barrick fair value closer to $26 than $42.
Business Quality: Tier One Assets, Cyclical Economics
The asset base is genuinely world-class. Nevada Gold Mines, the JV with Newmont in which Barrick holds 61.5%, contributes roughly half of attributable production and operates in the lowest-risk jurisdiction the company touches. The decentralized operating model under Bristow has delivered measurable cost discipline and a clean record of asset divestiture since the 2019 Randgold merger, as documented in Bloomberg coverage of the company.
The competitive moat is real but conditional. Tier One geology produces durable cost and scale advantages when gold trades above $2,000/oz. At $1,200/oz — which prevailed for much of the 2013-2018 cycle — even Tier One assets struggle to clear cost of capital. A moat that depends on the commodity price cycle is not the same kind of moat as a regulated utility or a payments duopoly.
Capital efficiency tells the same story. ROIC sits at 7.8-9.6% on a record-earnings year. Through-cycle ROIC is meaningfully lower. The business earns its cost of capital in good years and burns it in bad years.
Why the moat does not protect what we care about
A wide moat protects margins. It does not protect against host-government action or a 30% gold price decline. The two largest risks for Barrick Mining stock sit outside the perimeter of the moat. That is the conceptual reason the WP Score lands at 48 despite the operational quality.

Balance Sheet Fortress: The Strongest Pillar
This is where the bull case for Barrick Mining stock lives. Debt-to-equity sits at 0.20-0.25x, interest coverage exceeds 15x, and the current ratio is 3.5x. Cash covers more than 40% of total debt. Free cash flow has been positive in five of the last five years.
Stress test: if gold reverts to $1,850/oz and holds there for two years, Barrick remains solvent with comfortable interest coverage. The Barrick Mining dividend would compress materially under the 50%-of-FCF formula, but the company would not need to raise equity or sell assets at distressed prices.
The catch is that solvency is necessary, not sufficient. A solvent company can still see its share price decline 50% in a commodity downturn. That is permanent capital loss for an investor who needed the money during that window. Our framework, detailed in the Wealth Preservation Methodology, separates corporate survival from investor outcome.

Barrick Mining Dividend: Variable by Design
The Barrick Mining dividend deserves careful unpacking because it is structurally different from what most income investors expect.
The policy has two layers. A base floor of $0.175 per quarter ($0.70 annually) provides roughly 1.8% yield at the current price. On top of that, a variable component pays out 50% of attributable free cash flow. The most recent quarterly distribution was $0.42, reflecting elevated gold prices.
The variable layer is what creates the problem for income-focused capital. If earnings decline 40%, the dividend declines roughly 40% by formula. Compare that to the dividend stability of names covered in our Abbott Laboratories analysis or our Cintas research, where the income stream is structurally divorced from commodity prices.
Barrick has cut its dividend before — in 2015-2016 and again with the 2020 framework change. The history is not unbroken, and the formula link makes future cuts mechanical rather than discretionary.
Valuation: Cheap on Spot Gold, Expensive on Normalized
The valuation question that matters: what earnings should you capitalize?
At spot gold ($2,650+/oz), trailing EPS produces a P/E near 13x and a forward P/E near 10-11x. By those numbers Barrick Mining stock looks cheap relative to a 5-year average around 25x.
At normalized gold ($2,000-2,200/oz) with AISC at $1,200/oz, normalized EPS lands closer to $1.75. Apply a 15x multiple — appropriate for a cyclical with elevated geopolitical exposure — and Barrick fair value is $26. That is a 33% discount to the current $38.72 print.
| Metric | Current | 5Y Average | Read |
|---|---|---|---|
| Trailing P/E | 13-20x | ~25x | Below average — flattering |
| Forward P/E | 10-11x | ~15x | Discount if estimates hold |
| EV/EBITDA | 8.8x | ~9-10x | In line |
| P/FCF | 31-32x | ~25x | Premium |
| P/B | 1.6-1.7x | ~1.7x | In line |
P/FCF at 31x against a 25x average suggests cash conversion is not as strong as the headline P/E implies. The SEC 10-K filings confirm the gap between accounting earnings and free cash flow widens during heavy capex years. Margin of safety to mid-cycle fair value: negative 33%.
Scenario Analysis: The Bear Case is Negative
We model three 10-year paths with explicit probability weights for Barrick Mining stock.
Bear Case (25% weight): -6% CAGR
Gold reverts to $1,800-2,000/oz. AISC inflates to $1,400/oz. Reko Diq is delayed or impaired. One African asset suffers a contract renegotiation. The multiple compresses to 12x on $1.20 normalized EPS. Price target: $22. Total return: -6% annualized.
Base Case (50% weight): 5.2% CAGR
Gold holds $2,200-2,400/oz mid-cycle. AISC stabilizes at $1,200/oz. Reko Diq comes online by 2029. Copper grows to roughly 20% of revenue. Price target: $54 with $9 cumulative dividends.
Bull Case (25% weight): 14% CAGR
Gold holds $2,800+/oz. Copper reaches $5/lb on electrification demand. Reko Diq, Lumwana, and Fourmile all execute on plan. Multiple re-rates to 18x. Price target: $110 with $20 cumulative dividends.
Probability-weighted expected return: 4.6% CAGR. Below our 7% inflation-plus hurdle. The critical observation is that the bear case is negative — meaning the position can compound losses across a decade.
Jurisdictional Risk: The Disqualifier for Barrick Mining Stock
This is the single dimension that ends the conversation.
| Region | Asset | Risk Level | Recent Action |
|---|---|---|---|
| Nevada (US) | NGM 61.5% | LOW | Stable |
| Mali | Loulo-Gounkoto | HIGH | 2024 contract renegotiation |
| Tanzania | North Mara, Bunyanhulu | HIGH | Past extended shutdowns |
| Pakistan | Reko Diq | VERY HIGH | Mid-2027 review; security pause |
| Zambia | Lumwana | MEDIUM | Resource nationalism risk |
| Papua New Guinea | Porgera | HIGH | Political instability flagged |
Roughly 40-50% of production sits in jurisdictions where governments have demonstrated willingness to renegotiate contracts. The Reuters coverage of the 2024 Mali standoff and the Financial Times reporting on Reko Diq security both document the pattern. Additional context appears in S&P Global Market Intelligence jurisdictional risk reports.
The Reko Diq commitment is the most acute concern. A $7B+ capital outlay in Balochistan, with a mid-2027 review extension already triggered, carries asymmetric downside.
Probability of greater than 50% permanent loss: 12-15%
This exceeds our 10% threshold. The 2008 cycle saw Barrick draw down roughly 70% peak to trough. Gold equities behave like equities — they sell off in broad risk-off moves regardless of bullion’s safe-haven status, as World Gold Council data confirms across multiple cycles.
Peer Comparison: Barrick Mining Stock vs Newmont and Agnico Eagle
| Dimension | Barrick (B) | Newmont (NEM) | Agnico Eagle (AEM) |
|---|---|---|---|
| AISC | $1,050-1,500/oz | ~$1,611/oz | ~$1,286/oz |
| Jurisdictional Risk | HIGH | MEDIUM | LOW |
| Debt/Equity | ~0.22x | ~0.32x | ~0.10x |
| Forward P/E | 10-11x | ~12x | ~22x |
| Dividend Yield | ~1.7% | ~2.5% | ~1.5% |
| 2008 Drawdown | -70% | -65% | -50% |
Agnico Eagle is the higher-quality wealth-preservation candidate among gold mining stocks 2026. Barrick Mining stock is cheaper because the geopolitical discount is justified, not because the market has mispriced the name. For broader portfolio context, our research on KKR and S&P Global illustrates the through-cycle return profile we prefer over commodity exposure.
Want to Follow This Research with Real Capital?
Reading research is one thing. Acting on it is another. Angelos Moschovakis is a verified eToro Popular Investor — copy his equity portfolio and access the same positions discussed in this B stock analysis. Copy the Moschovakis Capital equity portfolio on eToro →
eToro is a multi-asset platform. Your capital is at risk. Copy trading does not amount to investment advice.
Moschovakis Capital — Quantitative Division
Automated FX Execution: A Separate Return Stream
Equity research like this Barrick Mining stock analysis operates on a 3-10 year horizon. Our Quantitative Execution System operates on a different horizon entirely — fully automated 24/7 FX execution backed by a 2-year audited track record. Uncorrelated with equity beta or gold prices.
Monitoring Triggers and Re-Review Conditions
The recommendation on Barrick Mining stock is AVOID at $38.72, but the analytical work is reusable. Below are the conditions that would prompt a fresh look.
- Stock declines below $30: Margin of safety to mid-cycle Barrick fair value emerges.
- Reko Diq permanently impaired: Removes the largest single execution overhang.
- Mali and Tanzania contracts finalized: Reduces jurisdictional risk weighting.
- NewCo IPO completes: The standalone NewCo could qualify as a preservation candidate.
- Gold mean-reverts to $1,800-2,000 and Barrick Mining stock holds value: Indicates structural re-rating.
- Agnico Eagle valuation gap widens beyond 40% premium: Re-examine relative value.
Closing Position on Barrick Mining Stock
Three of five absolute requirements fail: bear case return is negative, base case falls short of the 7% hurdle, and probability of permanent loss exceeds 10%. The fortress balance sheet is real, the operating team is capable, and the assets are world-class. None of that changes the math. For capital that must be preserved across the next decade, gold-miner equity exposure with concentrated geopolitical risk is the wrong vehicle. For the full Barrick Mining stock analysis methodology, explore the equities research library.
Frequently Asked Questions
Is Barrick Mining a good stock to buy in 2026?
Barrick Mining stock fails three of five Moschovakis Capital wealth preservation requirements at $38.72. The bear case 10-year return is -6% CAGR, the base case is 5.2% (below our 7% hurdle), and the probability of greater than 50% permanent loss exceeds 10%. We rate it AVOID.
Will Barrick Mining stock go up?
Our probability-weighted 10-year price target is approximately $54, implying 4.6% CAGR including dividends. The bull case reaches $110; the bear case targets $22. Expected return does not justify the embedded downside risk.
What is the Barrick Mining dividend?
Barrick pays a base quarterly dividend of $0.175 ($0.70 annualized) plus a variable component equal to 50% of attributable free cash flow. The most recent quarterly payment was $0.42. Annualized run-rate yield is approximately 1.7% at $38.72.
Is Barrick Mining stock a buy or sell?
For wealth preservation portfolios, our recommendation is AVOID at $38.72. The Wealth Preservation Score is 48/100, well below our 65 buy threshold. We would re-review below $30, where margin of safety to our mid-cycle Barrick fair value of $26 begins to emerge.
What is the target price for Barrick Mining stock?
Our probability-weighted 10-year price target is $54, with a normalized mid-cycle Barrick fair value of $26. Margin of safety to mid-cycle fair value is currently negative 33%.
Why is Barrick Mining stock dropping?
Barrick Mining stock is sensitive to the gold price, AISC inflation, host-government actions in Mali, Pakistan, and Tanzania, and project-execution news at Reko Diq. Recent overhangs include the Reko Diq mid-2027 review extension and the Mali contract renegotiation.
Execution Infrastructure
For the execution of positions discussed in our research, we utilize the following institutional-grade platforms due to their regulatory compliance, liquidity, and reliability.
| Platform | Purpose |
|---|---|
| eToro | Equity execution — regulated, social trading infrastructure |
| Revolut | Multi-currency banking and FX |
| Interactive Brokers | Institutional-grade brokerage |
| Vantage | MT4/MT5 execution |
| Binance | Digital asset infrastructure |
| Hostinger | Web infrastructure |
Risk Disclaimer: Past performance is not indicative of future results. Moschovakis Capital is a technology provider and research publisher, not a licensed financial advisor. Trading and investing in financial instruments involves significant risk of loss. Do not invest more than you can afford to lose. The analysis presented is for informational purposes only and does not constitute personalized investment advice.
eToro Disclaimer: eToro is a multi-asset platform. The value of your investments may go up or down. Your capital is at risk. Copy trading does not amount to investment advice. The value of your investments may go up or down. Your capital is at risk. eToro USA LLC does not offer CFDs. Do not invest unless you are prepared to lose all the money you invest.
Affiliate Disclosure: Some links on this page are referral links. We may earn a commission at no extra cost to you. This does not influence our analysis or recommendations.
Don't have an eToro account yet? Open one here.