PepsiCo Stock Analysis 2026: 3 Warning Signals for PEP
PepsiCo Stock Analysis 2026: 3 Warning Signals for PEP
Key takeaways
- PepsiCo owns a durable franchise with 23 billion-dollar brands, but durability does not remove a negative 24.3% margin of safety at the corrected reference price.
- WP Score: 33.5/100 with a Downside Protection Score of 40/100. The equity does not clear the wealth-preservation gate.
- Independent fair value anchors average $153.28, while the corrected reference price of $202.60 implies a 32.2% premium to that average.
- A 24.89x core P/E and 2.92% dividend yield leave a thin dividend cushion, with a model-estimated probability-weighted return of +1.4% annualized.
- Framework classification: Avoid. This is a research observation, not personalized investment advice.
Executive summary
PepsiCo stock analysis 2026 corrects a reference-price error and reruns the framework. At the corrected price of $202.60, the stock trades at 24.89x core EPS, 33.77x GAAP EPS, and a fair value average of $153.28, producing a negative 24.3% margin of safety. The scenario model estimates a probability-weighted total return of +1.4% annualized, below the 7% hurdle, and the framework classifies the security as Avoid.
Table of Contents
- Why PepsiCo Stock Analysis Begins With Business Quality
- The Financial Fortress Falls Short in PepsiCo Stock Analysis
- PepsiCo Dividend Analysis at a 2.92% Yield
- PepsiCo Valuation Analysis: The Arithmetic of an Avoid
- PepsiCo Stock Analysis Scenario Table: Three Weighted Paths
- Risk Assessment: The Valuation Gap Remains
- Management, Governance, and Capital Allocation
- PepsiCo Peer Comparison Versus the Consumer Staples Sector
- Key Business Drivers and Monitoring Checklist
- Conclusion: The PepsiCo Stock Analysis Classification
- Frequently Asked Questions
Why PepsiCo Stock Analysis Begins With Business Quality
PepsiCo stock analysis 2026 starts with business quality because our Wealth Preservation framework treats consumer staples as defensive. The company sells everyday products across income levels, and demand stability is the first preservation characteristic. Twenty-three billion-dollar brands give the portfolio scale few rivals can match.
The FY2025 10-K filed with the U.S. Securities and Exchange Commission lists six reportable segments: PepsiCo Foods North America, PepsiCo Beverages North America, International Beverages Franchise, Europe-Middle East-Africa, Latin America Foods, and Asia Pacific Foods. The older seven-segment structure split Frito-Lay North America and Quaker Foods North America. The consolidation changes labels, not economics.
Beverages and convenient foods share one distribution system. That gives PepsiCo shelf presence and cross-category negotiation power a pure beverage or pure snack competitor cannot match. PepsiCo reports leading share positions, but it does not publish a precise current third-party percentage. The 35% U.S. snacks and 25% U.S. beverages figures from June 2024 are stale and are not relied upon in this PepsiCo stock analysis.
Financial performance confirms stability but also exposes growth limits. Revenue was $79.47 billion in 2021, $86.39 billion in 2022, $91.85 billion in 2024, and $93.9 billion in 2025, a 2.3% increase. The three-year average revenue growth of 2.5% trails the S&P 500’s 5.8%.
Gross margin recovered from about 53.0% in 2022 to 54.5% in 2024, but operating margin fell from 14.0% in FY2024 to 12.2% in FY2025. Net margin declined from 10.4% to about 8.7% on a GAAP basis as Rockstar and Be & Cheery impairments hit. Q1 2026 operating margin of 16.5% signals recovery, yet the trailing picture shows margin compression and acquisition noise.
The moat is real. Brand assets, route-to-market scale, and the franchise-company bottler mix create wide commercial presence. A high-quality business at a 32% premium to fair value still leaves a negative margin of safety. The business quality stage passes with a caveat: slow revenue growth and North American snack market share battles become a problem when you pay $202.60 per share for them.
[IMAGE alt=”PepsiCo stock analysis snack manufacturing conveyor line with potato chips” : salty snacks moving along production conveyor in plant]

The Financial Fortress Falls Short in PepsiCo Stock Analysis
The solvency gate matters most for wealth preservation, and the data present a mixed picture. Total debt is $52.73 billion against book equity near $18.04 billion, which produces a debt-to-equity ratio of 2.47. That sits above the framework’s 1.0 threshold and triggers a red flag outside regulated industries.
Trefis reports a 0.30 debt-to-equity figure, but that uses a market-value denominator based on a stale lower share price. The book-based 2.47 is the correct number for this PepsiCo stock analysis. Net cash per share is negative $30.82, and debt-to-FCF is 5.96, according to Finspry.
Cash generation runs stronger. Trailing twelve-month free cash flow reached $9.3 billion, up 31.4% year over year in the latest available filing. That implies an FCF margin near 9.6% on TTM revenue of $96.9 billion. CFO on an LTM basis is $13.5 billion, with CFO-to-revenue of 13.9%.
The credit footprint supports solvency. PepsiCo recently terminated and replaced two $5 billion unsecured revolving credit facilities with no outstanding borrowings at termination. The new syndicated revolvers include a $5.75 billion upsizing option, and the company issued €2.5 billion of senior notes across 2028, 2034, and 2038 maturities.
The stress test yields an ADEQUATE solvency assessment, not FORTRESS. A 30% revenue decline over two years would compress operating cash flow and pressure the $52.73 billion debt load. Earnings quality rates ACCEPTABLE but not pristine: GAAP net income fell from $9.578 billion in 2024 to $8.2 billion in 2025 on $1.9 billion of impairments, while core EPS sat at $8.14.
ROIC of 15.19% and ROCE of 15.79% confirm the business creates value above its cost of capital. The balance sheet leverage leaves less room for error than a preservation investor should demand, and that is why the fortress gate fails.

PepsiCo Dividend Analysis at a 2.92% Yield
PepsiCo pays a quarterly dividend of $1.48, annualizing to $5.92. At the corrected reference price of $202.60, the dividend yield is 2.92%. That sits inside the framework’s 1.5% to 5% sweet spot and provides some income cushion against price volatility.
Payout metrics are more alarming. On FY2025 GAAP EPS of $6.00, the payout ratio is 98.7%, above every framework threshold. Core EPS of $8.14 produces a 72.7% core payout ratio, below the 75% mature-company ceiling but above the 60% preferred growth-company level.
Free cash flow coverage worsens the picture. PepsiCo expects $7.9 billion of dividends in FY2026 against $9.3 billion of TTM FCF. That is an 85% FCF payout ratio and coverage of 1.18 times, below the 1.3-times safety threshold.
The stress test fails. If core earnings fell 40%, core EPS would be $4.88, insufficient to cover the $5.92 annual dividend. GAAP earnings would turn negative, and the dividend would need a payout above 100% of core earnings or a cut.
The company has historically protected its dividend through recessions, but the current cash-flow payout leaves limited cushion. If GLP-1-driven snack volume pressure and pricing rollbacks documented by TIKR materialize at the same time, the dividend buffer disappears. The available evidence supports a dividend sustainability assessment of AT RISK.
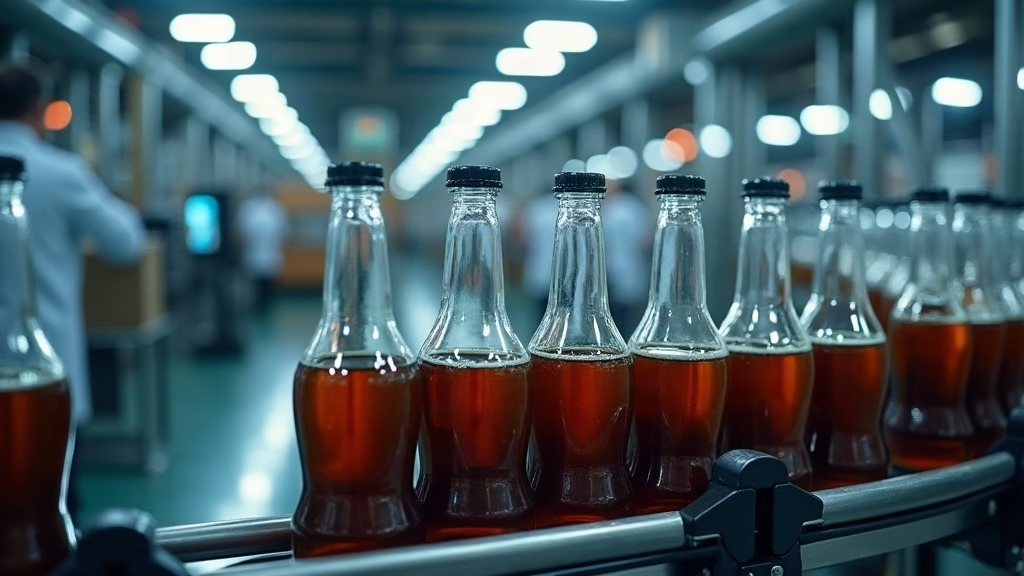
[IMAGE alt=”PepsiCo stock analysis beverage bottling plant with bottles on filling line” : beverage bottling factory with bottles on filling line]

PepsiCo Valuation Analysis: The Arithmetic of an Avoid
The valuation stage is decisive in this PepsiCo stock analysis. The corrected reference price is $202.60, not the previously published $2,026.00 figure, which contained a decimal error. Every multiple below reflects the corrected price.
| Metric | Value |
|---|---|
| P/E (GAAP, FY2025 EPS $6.00) | 33.77x |
| P/E (Core, FY2025 EPS $8.14) | 24.89x |
| Forward P/E (core EPS $8.96) | 22.61x |
| P/FCF (FCF/share $6.45) | 31.41x |
| P/S (LTM revenue/share $70.47) | 2.88x |
| P/B (book value/share $15.60) | 12.99x |
| Dividend Yield | 2.92% |
| EV/EBITDA (approx.) | ~14.4x |
| PEG (core P/E / 4.55% growth) | 5.47x |
Independent fair-value anchors cluster with a simple average of $153.28. The calculation is (144.71 + 132.00 + 151.70 + 167.00 + 171.00) divided by five. StockAnalysis produces a DCF intrinsic value of $144.71 and a blended estimate of $132.00. MarketBeat‘s consensus target is $151.70, and TIKR’s mean target runs $167.00 to $171.00.
The resulting margin of safety is negative 24.3%. The calculation is $153.28 minus $202.60, divided by $202.60. You pay a 32.2% premium to model-estimated fair value. The $165.00 anchor used previously represented only a 20-times earnings multiple, not the average of the independent estimates.
The gap cannot close quickly through operating performance. If core EPS grows 5% annually for ten years to $13.26 and the market applies a 20-times multiple, the terminal value reaches $265.20, which is 31% above the current price but produces only a 2.7% annualized total return, below the hurdle. The most optimistic target of $195.00 sits only 3.7% below the current price.
PepsiCo trades at a clear premium to the consumer staples sector on earnings multiples, but the valuation gap is not the catastrophic mispricing a decimal error suggested. The framework’s rule classifies equities trading more than 40% above the five-year average as avoid, and this price breaches that threshold based on forward P/E. The valuation stage alone supports an AVOID classification, which is a research output, not a directive.
PepsiCo Stock Analysis Scenario Table: Three Weighted Paths
The scenario analysis uses a ten-year horizon and three weighted states. These are model estimates, and the weights are 25% bear, 50% base, and 25% bull. Actual outcomes may differ materially from the assumptions shown. No return scenario is guaranteed.
Bear case at 25% weight. Revenue is flat for a decade, GLP-1 snack volume decline accelerates, pricing rollbacks compress margins, and the terminal multiple falls to 14 times. Core EPS stagnates near $7.50, and the terminal price is $105.00. The total return is -6.4% annualized.
Base case at 50% weight. Organic revenue grows 3% and core EPS grows 5% annually to $13.26 by 2036. A 20-times terminal multiple produces a $265.20 terminal price. From $202.60, that is a +2.7% annualized total return, below the 7% hurdle.
Bull case at 25% weight. PFNA volume recovers, the World Cup lifts Frito-Lay globally, and core EPS grows 7% annually to $16.01. A 24-times terminal multiple yields $384.24. The total return is +6.6% annualized.
| Scenario | Weight | Key Assumptions | 10-Yr Price Target | Total Return CAGR | Contribution |
|---|---|---|---|---|---|
| Bear | 25% | Flat revenue, core EPS $7.50, 14x terminal | $105.00 | -6.4% | -1.6% |
| Base | 50% | 3% organic rev, 5% core EPS CAGR, 20x terminal | $265.20 | +2.7% | +1.4% |
| Bull | 25% | 7% core EPS CAGR, 24x terminal | $384.24 | +6.6% | +1.7% |
| Probability-Weighted | +1.4% CAGR |
The probability-weighted return is +1.4% annualized. That falls below the framework’s 7% hurdle. The bear case terminal drawdown is approximately 48%, and the model assigns a 25% probability to that path. The scenario table supports the AVOID classification because the base and bull cases do not generate a sufficient margin over the hurdle for a leveraged consumer staple with a thin dividend cushion. Downside risk includes demand shifts, margin compression, and multiple re-rating, and the model does not guarantee any scenario probability.
[IMAGE alt=”PepsiCo stock analysis distribution truck fleet outside warehouse at dawn” : tractor trailers lined outside distribution center]
Risk Assessment: The Valuation Gap Remains
Valuation remains the primary risk, but the corrected figures change the intensity. At $202.60, the shares trade at 24.89 times core earnings and 33.77 times GAAP earnings. Intrinsic anchors range from $132.00 to $195.00, so reversion to the lowest anchor requires a 34.8% decline, compared with the catastrophic decline implied by the decimal error.
The prior version of this PepsiCo stock analysis contained a forward-looking claim that the probability of a permanent loss greater than 50% exceeded 90%. That claim is withdrawn. The current scenario model estimates a bear case drawdown of approximately 48% with 25% weight, which is a material but not catastrophic loss.
Business risks remain real but secondary to price. Surgical price cuts on Lay’s and Doritos, increased advertising spend, GLP-1-driven volume pressure, and $12 billion of long-term snack-demand threat all pressure the income statement. Barclays flagged oil and currency headwinds for 2026 in a research note.
Regulatory and ESG exposure is present. The 10-K cites climate-change and single-use-plastics regulation as demand and reputation risks. The PX14A6G filing describes palm oil human-rights exposure and continued operations in high-risk areas, including Russia.
Litigation is broad. The 10-K lists advertising, product-label, ingredient, food-safety, personal-injury, IP, privacy, employment, tax, environmental, and shareholder-initiated actions as ongoing categories. Financial risk includes $52.73 billion of debt, a 2.47 book debt-to-equity, and an 85% FCF dividend payout.
The risk level is ELEVATED. The underlying business holds a RESILIENT recession profile, but a resilient business at 24.89 times core earnings still produces a meaningful drawdown when the multiple normalizes. For transparency, Angelos Moschovakis is a verified eToro Popular Investor. This research is published for informational purposes. It does not constitute investment advice or a solicitation to copy trades. eToro is a multi-asset platform. The value of your investments may go up or down. Your capital is at risk. Copy trading does not amount to investment advice. Past performance is not an indication of future results.
Management, Governance, and Capital Allocation
Ramon Laguarta serves as chairman and chief executive officer. Jamie Caulfield serves as executive vice president and chief financial officer. The research set contains little on tenure or compensation structure, so a full management-quality score cannot be completed.
Capital allocation is mixed but defensible. FY2026 guidance includes $8.9 billion of cash returns, split between $7.9 billion of dividends and $1.0 billion of buybacks. The small buyback is appropriate given the debt load. Rockstar Energy generated a $1.9 billion impairment in FY2025, a mark against that 2020 acquisition.
Credit management shows discipline. Management terminated two $5 billion revolving facilities with no outstanding borrowings and replaced them with investment-grade revolvers. No restatement, internal-control weakness, auditor warning, or going-concern qualification appears in the material.
Insider activity is routine. A recent filing shows director Robert C. Pohlad received 398.3229 phantom stock units through dividend-equivalent reinvestment. Form 144 and Form 4 filings from directors reflect tax-planning activity rather than a coordinated insider-selling signal.
Management quality rates GOOD, not EXCELLENT. The capital-allocation record carries a blemish, and leverage limits future flexibility. The management team is not the primary driver of the AVOID classification. The valuation gap is.
PepsiCo Peer Comparison Versus the Consumer Staples Sector
The research data does not contain named-peer tables for Coca-Cola, Mondelez, Kraft Heinz, or General Mills, so this PepsiCo stock analysis compares against sector and index references.
| Dimension | PEP (current) | Consumer Staples Sector | S&P 500 |
|---|---|---|---|
| P/E (forward/core) | 22.61x | 13.94–22.3x | 22.1–38.8x |
| EV/EBITDA | ~14.4x | 14.0x | n/a |
| P/FCF | 31.41x | n/a | 19.2x |
| P/S | 2.88x | n/a | 3.1x |
| P/B | 12.99x | n/a | n/a |
| Dividend Yield | 2.92% | n/a | ~1.3% |
| Operating Margin | 12.2% FY2025 | n/a | 18.6% |
| ROIC | 15.19% | n/a | n/a |
| Debt/Equity (book) | 2.47 | n/a | 0.21 |
The comparison is mixed. The current core P/E of 24.89 runs above the consumer staples sector average and above the S&P 500’s forward range lower bound. EV/EBITDA near 14.4 times aligns with the sector median of 14.0. P/FCF of 31.4 times is above the S&P 500’s 19.2, and the 2.92% dividend yield exceeds the S&P 500’s approximate 1.3%.
Consumer staples names in our coverage include Walmart and Costco, both of which trade at lower earnings multiples despite strong brand positions. ROIC of 15.19% confirms a genuine franchise, but the stock’s P/FCF and payout ratios reduce the investment case. The company may deserve a premium; it does not justify a 31-times free-cash-flow multiple under this framework.
Moschovakis Capital — Quantitative Division
Automated FX Execution: A Separate Return Stream
While this equity position may require patience over a 3 to 5 year horizon, our FX system operates on a different time horizon. The Quantitative Execution System provides automated FX execution. Past performance is not indicative of future results, and automated trading involves risk of loss, including drawdowns.
Key Business Drivers and Monitoring Checklist
Organic revenue growth separates real demand from acquisitions and currency. Q1 2026 organic growth reached 2.6%, with FY2026 guidance of 2% to 4% reaffirmed. A bull threshold sits above 4%; a bear threshold triggers below 2% or negative for two consecutive quarters.
PFNA volume is the single most watched metric. Frito-Lay snacks are the margin engine, and they face GLP-1-driven demand risk. Q1 2026 delivered the first positive North America Foods volume in over a year, with EPS of $1.61 beating consensus by $0.06.
The monitoring checklist identifies no entry threshold. The next earnings release provides a data point. Verify revenue, PFNA volume, margin, and guidance against consensus. Any dividend cut from $1.48 quarterly would downgrade dividend sustainability to UNSUSTAINABLE.
[IMAGE alt=”PepsiCo stock analysis retail store shelves with soft drinks and snacks” : grocery aisle stocked with beverage bottles and snack bags]
Conclusion: The PepsiCo Stock Analysis Classification
PepsiCo the company is a strong business. PepsiCo the stock at $202.60 fails the wealth-preservation mandate because model-estimated fair value sits at $153.28 and the scenario model produces a probability-weighted return below the hurdle. The valuation stage alone supports the AVOID classification in this PepsiCo stock analysis.
Investors should form their own conclusions. This is a research observation, not personalized advice.
Frequently Asked Questions
Is PepsiCo stock analysis 2026 a buy or avoid?
The framework classifies PepsiCo stock analysis 2026 as Avoid. At $202.60, the stock trades at 24.89x core earnings and 33.77x GAAP earnings, above sector averages. Model-estimated fair value is $153.28, implying a negative 24.3% margin of safety.
What is PepsiCo stock analysis’s fair value estimate for 2026?
The simple average of independent anchors is $153.28. The calculation is 144.71 + 132.00 + 151.70 + 167.00 + 171.00, divided by five. This estimate may change with new data and uses model assumptions.
What is PepsiCo’s dividend yield in 2026?
The annual dividend of $5.92 produces a 2.92% yield at $202.60. The GAAP payout ratio is 98.7%, and the FCF payout ratio is 85%, leaving limited cushion for demand shocks.
Why does PepsiCo stock analysis show a negative margin of safety?
The margin of safety compares price to fair value. At $202.60 against a $153.28 fair-value average, the gap is -24.3%. The model estimates that a reversion to fair value would produce a negative return over a multi-year horizon.
What is the main risk in this PepsiCo stock analysis?
The main risk is valuation. The stock trades above sector-average core P/E and P/FCF, and the dividend payout coverage is below the framework’s safety threshold. Downside risks include GLP-1-driven snack volume pressure and pricing rollbacks.
For the full PepsiCo stock analysis methodology and the complete Moschovakis Capital research framework, explore the equities library at moschovakiscapital.com/equities/.
Execution Infrastructure
For the execution of positions discussed in our research, we utilize the following institutional-grade platforms due to their regulatory compliance, liquidity, and reliability.
| Platform | Purpose |
|---|---|
| eToro | Equity execution — regulated, social trading infrastructure |
| Revolut | Multi-currency banking and FX |
| Interactive Brokers | Institutional-grade brokerage |
| Vantage | MT4/MT5 execution |
| Binance | Digital asset infrastructure |
| Hostinger | Web infrastructure |
Risk Disclaimer: Past performance is not indicative of future results. Moschovakis Capital is a technology provider and research publisher, not a licensed financial advisor. Trading and investing in financial instruments involves significant risk of loss. Do not invest more than you can afford to lose. The analysis presented is for informational purposes only and does not constitute personalized investment advice.
eToro Disclaimer: eToro is a multi-asset platform. The value of your investments may go up or down. Your capital is at risk. Copy trading does not amount to investment advice. The value of your investments may go up or down. Your capital is at risk. eToro USA LLC does not offer CFDs. Do not invest unless you are prepared to lose all the money you invest.
Affiliate Disclosure: Some links on this page are referral links. We may earn a commission at no extra cost to you. This does not influence our analysis or recommendations.
Frequently asked questions
Answers below are quoted directly from this analysis, as published on 1 October 2026.
What is the Wealth Preservation Score for PepsiCo?
What is the fair value estimate for PepsiCo?
Does PepsiCo offer a margin of safety?
What are the main risks to the PepsiCo thesis?
Research and opinion, not investment advice. Figures are as at the publication date above and are not maintained in real time.
Related Research
Don't have an eToro account yet? Open one here.