Mirion Stock Analysis 2026: 5 Red Flags for Investors

↓ Download the full research PDF · free, no email required
Mirion Stock Analysis 2026: 5 Red Flags for Investors
Key takeaways
- Mirion owns a defensible radiation-safety niche, but a leveraged balance sheet and premium valuation remove any margin of safety for capital preservation.
- WP Score: 38/100 — fails our proprietary Wealth Preservation model threshold of 50.
- Base case implies roughly 3.5% CAGR; our model’s fair value estimate near €10.50 versus a €13.15 live price implies a negative margin of safety of about −20% (forward-looking estimate; see disclaimer below).
- Biggest risk our model flags: net debt/EBITDA near 4.0x with weak interest coverage and $775M of convertible notes.
- Model conclusion: our scoring framework classifies Mirion as “Avoid” — no dividend cushion, a materially negative modelled bear case, and a valuation priced for perfection. This is the output of our proprietary model, not personalised advice.
Forward-looking statements disclaimer: Fair value estimates (e.g. €10.50), scenario CAGRs (including the −10% bear case) and all projections in this article are forward-looking outputs of the publisher’s proprietary model. They are estimates, not facts. Actual results may differ materially. Nothing here is personalised investment advice; readers should conduct their own research and consider their own circumstances.
Executive summary
Mirion Technologies (MIR) trades at €13.15 (US$14.98) with a Wealth Preservation Score of 38/100 and a model fair value estimate near €10.50, implying a negative margin of safety of roughly −20% (a forward-looking estimate — see disclaimer above). The company runs a genuinely sticky radiation-detection franchise, yet net debt/EBITDA near 4.0x, a first-ever GAAP profit only in 2025, and no dividend leave the downside asymmetric. Model conclusion: our scoring framework classifies the stock “Avoid” until leverage falls below 2.5x and free cash flow turns durably positive. This is a model output, not advice directed at any individual reader.
Table of Contents
- The Business: A Real Moat in Radiation Safety
- Financial Fortress: Where the Mirion Stock Analysis Breaks
- The Missing Income Cushion
- Valuation: Priced for Perfection
- Scenario Analysis and the Bear Case Problem
- Risk Assessment for a Preservation Mandate
- Peer Comparison: The Weakest Fortress
- The Mirion Stock Analysis Verdict
- Frequently Asked Questions
This Mirion stock analysis starts from a simple premise: a good business and a good investment are two different things. Mirion measures and manages radiation for nuclear plants, hospitals, defense agencies, and research labs across more than 120 countries. Regulation makes its equipment sticky. The problem this Mirion stock analysis keeps returning to is the balance sheet, the valuation, and the absence of any income to hold you through a drawdown.
The capital allocator’s question is not whether Mirion does something useful. It clearly does. The question this Mirion stock analysis asks is whether the current price offers a margin of safety. On our model’s numbers, it does not.
The Business: A Real Moat in Radiation Safety
Mirion sells radiation detection, measurement, dosimetry, monitoring, software, and services. Two segments carry the company: Nuclear & Safety at roughly 72% of Q1 2026 revenue, and Medical at roughly 28%, per Mirion’s Q1 2026 earnings release. The value comes from regulatory embeddedness plus an installed base that generates replacement and service demand.
Management points to about 70% recurring-and-replacement revenue. A more conservative framing puts pure recurring streams at 30–35%. Either way, this is a real moat. Nuclear plants cannot swap out certified radiation-monitoring equipment on a whim, and calibration and dosimetry recur year after year. The International Atomic Energy Agency and national bodies such as the U.S. Nuclear Regulatory Commission mandate the monitoring standards that underpin this stickiness.
The end market is stable to growing. Life extensions, new builds, and the small modular reactor buildout give the nuclear segment a multi-decade tailwind, a trend documented by the International Energy Agency and the World Nuclear Association. On the business-quality axis alone, Mirion earns a continue verdict within our model. This is not a company in secular decline.

Cyclicality is the caveat. Project-based equipment sales are lumpy and budget-sensitive. Recurring service revenue provides partial insulation, but a nuclear capex slowdown would still hit order intake. For a business that carries this much debt, that sensitivity matters more than it would for a debt-free peer. Readers can weigh this alongside our broader Wealth Preservation methodology.
Financial Fortress: Where the Mirion Stock Analysis Breaks
This section is where the thesis fails on our model’s inputs. Per Mirion’s Q1 2026 Form 10-Q filed with the SEC (balance sheet dated 31 March 2026), Mirion carries approximately $1.23B of total debt against $419M of cash and equivalents. On our calculation using trailing-twelve-month adjusted EBITDA from the same filing, net debt/EBITDA sits near 4.0x. Our preservation framework wants that figure below 2.5x, and the gap is not marginal. Readers should verify each figure directly against Mirion’s filings on the SEC EDGAR database.
According to that same 10-Q, the $775M of convertible notes were issued in 2025; readers should confirm the tranche, coupon and conversion terms against the note’s indenture as filed. That structure adds future dilution risk on top of the leverage already in place. Interest payments are not well covered by earnings.
The Altman Z-Score and What It Uses
We calculate an Altman Z-Score of 1.83, which lands in the grey zone for distress risk. To be transparent about the model: this uses the original 1968 Altman Z-Score for public manufacturers (Z = 1.2·working capital/total assets + 1.4·retained earnings/total assets + 3.3·EBIT/total assets + 0.6·market value of equity/total liabilities + 1.0·sales/total assets). Inputs are drawn from Mirion’s Q1 2026 10-Q balance sheet (dated 31 March 2026) and the €/US$ market capitalisation at the €13.15 reference price. Because Mirion carries a large accumulated deficit, the retained-earnings term is negative and pulls the score down; readers applying the revised or non-manufacturer variant would obtain a different figure.
The Profitability Timeline
Consider the profitability timeline. Per Mirion’s annual filings, the company turned its first GAAP annual profit in 2025 at $29.8M net income. That followed a $36.6M loss in fiscal 2024 and a $98.7M loss in fiscal 2023. The company sits on a $512.7M accumulated deficit as reported in the Q1 2026 10-Q. One year of thin profit does not clear our fortress bar.
The Stress Test
Apply a 30% revenue shock across two years. Would Mirion remain solvent? Questionable on our model. High leverage plus weak interest coverage leaves little buffer. Could it avoid a dilutive raise? Unlikely, given the convertible structure and thin free cash flow.
Free cash flow declined recently, and the FCF yield reads negative or near-zero on our estimate. A company that cannot self-fund through a downturn, cannot pay a dividend to cushion the wait, and would likely need to refinance into whatever credit market exists at the time is the opposite of asymmetric downside. Within our Mirion stock analysis the solvency assessment is marginal, bordering unacceptable.
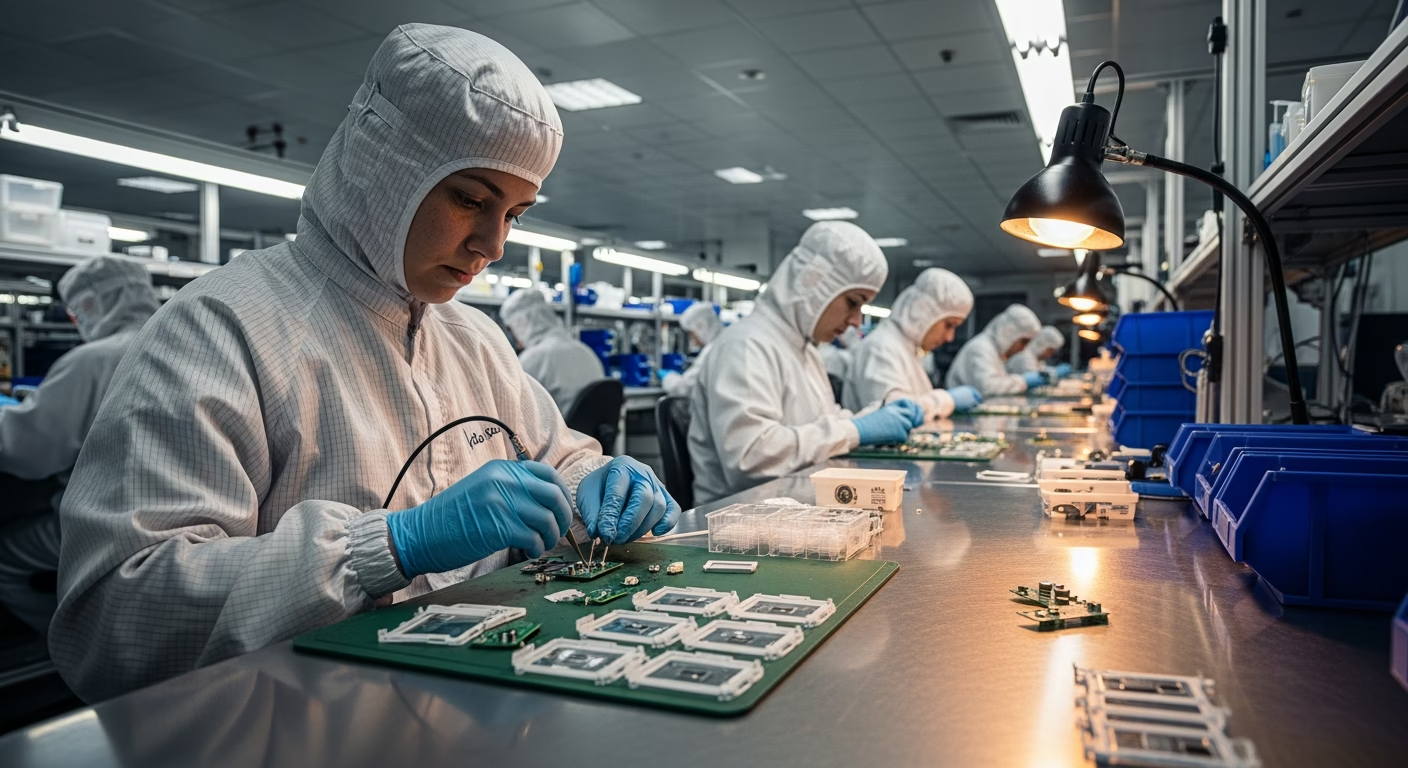
Earnings quality reads questionable. Operating margin came in at 2.8% in 2025 per company filings. Heavy acquisition amortization and large one-off items sit inside the results. The net income is real, but it is thin and freshly positive. For an institutional Mirion stock analysis focused on Wealth Preservation, that combination triggers heightened scrutiny.
The Missing Income Cushion
Mirion pays no dividend. For a preservation mandate, this removes the income cushion that lets an investor hold through drawdowns and collect return regardless of price action. Total return depends entirely on price appreciation and multiple direction.
Compare that against a roughly 4% risk-free high-yield savings account — the prevailing environment is tracked at the St. Louis Fed’s FRED database. A stock that pays nothing while you wait must deliver appreciation well above that to justify the risk premium. Mirion’s probability-weighted return of roughly 2.5% CAGR (a model estimate) does not clear that hurdle. The dividend yield of 0.0% scores zero contribution to income reliability in our framework.
This matters more than headline growth narratives suggest. Dividend yield and free cash flow give optionality during a sell-off. Without them, an investor is fully exposed to the multiple, and Mirion’s multiple has room to fall. Our full Wealth Preservation methodology weights this income cushion heavily for exactly this reason.
Valuation: Priced for Perfection
At €13.15 the stock trades at a forward P/E in the low-40s, EV/EBITDA near 27x, and P/FCF above 50x on our estimates. Industrial and medical-technology peers trade at 11–20x EV/EBITDA. That is a premium multiple for a company that just crossed into profitability and carries peer-topping leverage.
| Metric | Current | Peer Range | Assessment |
|---|---|---|---|
| Forward P/E | 41–43x | — | Expensive |
| EV/EBITDA | ~27x | 11–20x | Premium |
| P/FCF | 53–65x | — | Expensive |
| P/B | 2.3–3.3x | — | Unreliable |
Normalize on a peer EV/EBITDA of roughly 16x against Mirion’s 27x and our model returns a fair value estimate near €10.50 — a forward-looking figure, see disclaimer above. That is a negative margin of safety of about −20% versus the live price. The analyst average target of $23.80 (per consensus aggregated on MarketScreener) implied only single-digit upside from a lower reference price, and against the $14.98 live price the setup is thin.
The current price implies continued high single-digit revenue growth plus meaningful margin expansion. The market prices Mirion as a growth compounder rather than a newly-profitable, highly-levered industrial. That framing amplifies downside on any earnings miss.
Scenario Analysis and the Bear Case Problem
With no dividend, all return is price-driven. We model three ten-year total-return paths and weight them. These are forward-looking model outputs, not forecasts of actual results — see the disclaimer above.
| Scenario | Total CAGR | Weight | Contribution |
|---|---|---|---|
| Bear | −10% | 30% | −3.0% |
| Base | +3.5% | 50% | +1.75% |
| Bull | +11% | 20% | +2.2% |
| Expected | ~2.5% |
The bear case assumes nuclear project slippage, RTQA weakness, and margin compression. On the margin point specifically: per Mirion’s Q1 2026 earnings presentation, the Nuclear & Safety segment adjusted operating margin was reported at 11.3% in Q1 2026, down from 16.3% in Q1 2025. Readers should verify these segment figures in the relevant 10-Q and earnings materials, as this year-over-year deterioration is the primary quantitative support for our bear case. In that scenario multiples contract toward 15x EV/EBITDA, and the company refinances at a higher cost with possible dilution. That path delivers roughly −10% modelled CAGR.
Here is the disqualifier within our framework. It requires a bear-case total return of at least 0%. Mirion’s modelled bear case is materially negative. A newly-profitable, highly-levered name with no income cushion breaks the absolute preservation gate before the base case even enters the conversation.
The base case is unremarkable. Revenue grows 6–7%, margins improve slowly, leverage reduces gradually, and the multiple mean-reverts toward 20x EV/EBITDA. That still produces only about 3.5% modelled CAGR, below the risk-free alternative. The bull case at 11% requires the SMR buildout to accelerate and leverage to fall below 2.5x, a low-probability stack of favorable outcomes.
Risk Assessment for a Preservation Mandate
The primary risk our model flags is leverage and refinancing. Net debt/EBITDA near 4.0x, weak interest coverage, and $775M of convertibles combine into a single vulnerability that dominates every other consideration.
Revenue concentration adds to it. Roughly 72% of revenue sits in nuclear and safety, sensitive to policy and project timing. Profitability durability is unproven with one year of GAAP profit and a large accumulated deficit. Integration of the Paragon and Certrec acquisitions is dragging Nuclear & Safety margins, consistent with the segment margin compression noted above.
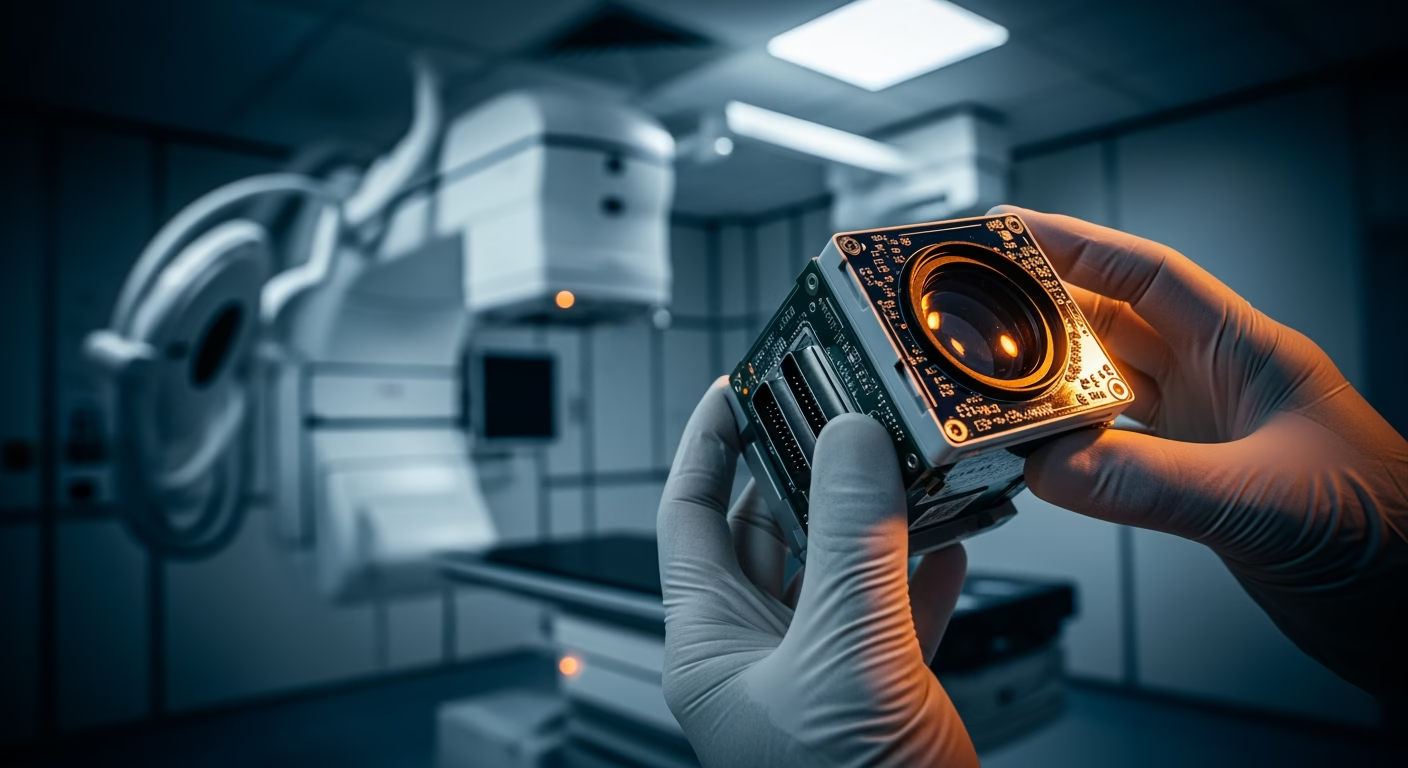
The model’s probability of a permanent loss greater than 50% reads roughly 20%. That exceeds our 15% ceiling and the tightened 10% threshold applied to growth and thin-profit names. Risk level: elevated. Recession profile: vulnerable. For an institutional Mirion stock analysis, that combination is a hard stop within the scoring model.
Watch high-yield credit spreads as a leading indicator, tracked via the St. Louis Fed’s FRED database. If spreads widen materially, Mirion’s refinancing cost rises directly. A uranium or nuclear ETF breaking its trend would signal capex-sentiment deterioration. Either signal warrants a fresh look within days.
Author disclosure: The author, Angelos Moschovakis, is a verified eToro Popular Investor and may hold positions in one or more of the securities discussed in this article. This disclosure is provided for transparency and is not a recommendation. Nothing in this article is personalised investment advice; readers should conduct their own research and consider consulting a licensed adviser before making any investment decision. The author’s public eToro profile is available at etoro.com/people/moschovakis.
Peer Comparison: The Weakest Fortress
Set Mirion against AMETEK and Inficon, two established instrumentation names. The gap on balance-sheet strength is stark. Peer multiples below are sourced from each company’s most recent filings and consensus data on MarketScreener as of Q1 2026; readers should reverify given market movement.
| Dimension | MIR | AMETEK | Inficon |
|---|---|---|---|
| Net Debt/EBITDA | ~4.0x | <2x | ~0 (debt-free) |
| Interest Coverage | Weak | Strong | N/A |
| Dividend | None | Yes | Yes |
| EV/EBITDA | ~27x | ~19x | ~22x |
| FCF Quality | Weak | Strong | Strong |
On these figures Mirion’s ~27x EV/EBITDA sits above both AMETEK (~19x) and Inficon (~22x), confirming the premium-multiple claim in quantitative terms rather than qualitative descriptors. Mirion is also the weakest peer on balance-sheet fortress and pays no dividend. Inficon runs debt-free. AMETEK carries strong interest coverage and pays a dividend. Both offer better balance-sheet characteristics for a preservation portfolio in the same industrial-instrumentation space.
Readers weighing higher-quality industrial and financial compounders can compare our published notes on Cintas and S&P Global, both of which pair durable free cash flow with disciplined capital allocation. The contrast with Mirion’s leverage-forward, dilutive financing model is instructive. See also our full equities research library for further comparisons.
Moschovakis Capital — Quantitative Division
Automated FX Execution: A Separate Return Stream
Our Quantitative Execution System is a fully automated 24/7 FX execution framework that operates uncorrelated to any single equity thesis. It is designed as a return stream that does not depend on a nuclear-capex cycle.
Risk warning: Trading foreign exchange carries a high level of risk and can result in the loss of some or all of your capital. Any track record referenced is a record of past results; past performance is not indicative of, and is no guarantee of, future results. References to an “audited” record mean a third-party review of historical trade data over the stated period; it does not verify future returns, does not remove the risk of loss, and should not be relied upon as a projection. This block is informational and is not personalised advice or a solicitation. Conduct your own due diligence and consider your own circumstances before trading.
The Mirion Stock Analysis Verdict
Our proprietary scoring model classifies Mirion as “Avoid” for a capital-preservation mandate. Multiple disqualifying factors are present in the model, and any one alone would be sufficient to fail the screen. The modelled bear-case total return runs materially negative at roughly −10% CAGR (a forward-looking estimate), failing the preservation gate that requires at least 0%. This is a conclusion of the model, not personalised advice to any reader.
Solvency reads marginal with net debt/EBITDA near 4.0x, weak interest coverage, and near-zero free cash flow. There is no dividend to cushion the wait. Valuation is expensive with a model-derived negative margin of safety of about −20%. The WP Score of 38 sits well below our 50 threshold, and the model’s probability of a greater-than-50% permanent loss reads roughly 20%.
What would change the model’s assessment: net debt/EBITDA below 2.5x, two consecutive years of clearly positive free cash flow, Nuclear & Safety margins recovering toward 16%, and a de-rating to roughly €8.50 or below. None of those are present today. We would revisit after two to three quarters of deleveraging evidence.
The business is worth watching. On our model’s numbers, the stock at this price does not clear a capital-preservation screen. This Mirion stock analysis concludes that, within our framework, patience and a lower entry point score better than paying a premium multiple for a freshly-profitable, highly-levered industrial. For the full Mirion stock analysis methodology and the complete Moschovakis Capital research framework, explore the equities library.

Frequently Asked Questions
Is Mirion Technologies a good investment in 2026?
Our proprietary Wealth Preservation scoring model classifies Mirion as “Avoid” for a capital-preservation mandate — this is a model conclusion, not personalised advice, and your own circumstances may differ. The company carries net debt/EBITDA near 4.0x, pays no dividend, and trades at a premium valuation with a model-derived negative margin of safety of roughly −20% (a forward-looking estimate). The modelled bear-case total return runs materially negative, which fails the model’s preservation gate. Readers should conduct their own research.
Does Mirion Technologies pay a dividend?
No. Mirion pays no dividend, so its dividend yield is 0.0%. For a preservation investor this removes the income cushion that lets you hold through drawdowns, leaving total return entirely dependent on price appreciation and multiple direction.
Is Mirion stock overvalued at €13.15?
On our model’s inputs, yes. At €13.15 the stock trades at a forward P/E in the low-40s and EV/EBITDA near 27x, versus a peer range of 11–20x. Normalizing on a peer multiple of roughly 16x yields a model fair value near €10.50 (a forward-looking estimate; actual results may differ materially), implying material overvaluation on our framework.
How much debt does Mirion Technologies carry?
Per Mirion’s Q1 2026 Form 10-Q filed with the SEC (balance sheet dated 31 March 2026), Mirion holds about $1.23B of total debt against $419M of cash, putting net debt/EBITDA near 4.0x on our calculation. It also issued $775M of convertible notes in 2025 per the same filing, adding future dilution and refinancing risk. Interest payments are not well covered by earnings. Verify figures on SEC EDGAR.
What would make Mirion stock worth buying?
Our Mirion stock analysis model would reconsider on four conditions: net debt/EBITDA falling below 2.5x, two consecutive years of clearly positive free cash flow, Nuclear & Safety margins recovering toward 16%, and a de-rating to roughly €8.50 or below. None of those are present today. This describes the model’s criteria, not a recommendation directed at you.
Execution Infrastructure
For the execution of positions discussed in our research, we utilize the following institutional-grade platforms due to their regulatory compliance, liquidity, and reliability.
| Platform | Purpose |
|---|---|
| eToro | Equity execution — regulated, social trading infrastructure |
| Revolut | Multi-currency banking and FX |
| Interactive Brokers | Institutional-grade brokerage |
| Vantage | MT4/MT5 execution |
| Binance | Digital asset infrastructure |
| Hostinger | Web infrastructure |
Risk Disclaimer: Past performance is not indicative of future results. Moschovakis Capital is a technology provider and research publisher, not a licensed financial advisor. Trading and investing in financial instruments involves significant risk of loss. Do not invest more than you can afford to lose. The analysis presented is for informational purposes only and does not constitute personalized investment advice.
eToro Disclaimer: eToro is a multi-asset platform. The value of your investments may go up or down. Your capital is at risk. Copy trading does not amount to investment advice. The value of your investments may go up or down. Your capital is at risk. eToro USA LLC does not offer CFDs. Do not invest unless you are prepared to lose all the money you invest.
Affiliate Disclosure: Some links on this page are referral links. We may earn a commission at no extra cost to you. This does not influence our analysis or recommendations.
Mirion: the full research PDF
The complete report behind this analysis — DCF model, valuation tables and scoring detail. No email, no form.
Download the PDFPDF · 47.8 KB
Frequently asked questions
Answers below are quoted directly from this analysis, as published on 29 July 2026.
What is the Wealth Preservation Score for Mirion?
What is the fair value estimate for Mirion?
What are the main risks to the Mirion thesis?
Research and opinion, not investment advice. Figures are as at the publication date above and are not maintained in real time.
Related Research
Don't have an eToro account yet? Open one here.